
Table Of Contents
- Introduction
- Why Many Inventory Dashboards Fail
- Start With Daily Decisions
- Choose Core Inventory Metrics
- Build a Clear Layout
- Use Alerts for Exceptions
- Make Data Quality Visible
- Create Role-Based Views
- Implement and Improve the Dashboard
- Avoid Common Mistakes
- Measure Success
An effective inventory management dashboard does more than display stock counts. It helps warehouse, purchasing, operations, and finance teams recognize what needs attention, understand the likely impact, and take the next action without having to search through disconnected reports.
That distinction matters because inventory work happens continuously. Orders are received, picked, transferred, returned, counted, reserved, and adjusted throughout the day. A useful dashboard turns those changing signals into a practical operating view, rather than becoming another screen full of numbers.
Why Many Inventory Dashboards Fail
A dashboard can contain accurate data and still be unhelpful. Crowded layouts, delayed refreshes, vague labels, and too many competing metrics force users to interpret the information before they can act on it. In practice, a warehouse manager may need to open separate inventory, order, and supplier screens just to confirm that one fast-selling SKU is about to run out.
The better approach is decision-first design. Every prominent card, chart, filter, and alert should support a real choice, such as whether to reorder, transfer stock, recount a bin, prioritize receiving, or pause allocation. The broader discipline of inventory management connects these choices across purchasing, storage, fulfillment, and stock control.
Start With Daily Decisions
Begin with business questions, not visualizations. Ask what users need to know during a normal shift, then assign each question to an owner and a follow-up action.
- Which items are close to running out? Purchasing reviews demand and creates or expedites a replenishment order.
- Which products are moving too slowly? Operations reviews transfers, promotions, storage use, or purchasing controls.
- Which purchase orders may arrive late? Buyers contact suppliers and update expected receipt dates.
- Where is the inventory held in the wrong location? Warehouse leads create transfer or replenishment tasks.
- Which records need a recount? Inventory control assigns a cycle count and investigates discrepancies.
Choose Core Inventory Metrics
Start with a focused metric set. Adding measures is useful only when users can explain how each measure improves the decision.
Availability and Demand
- Stock on hand: The physical quantity recorded at each location.
- Available stock: Quantity remaining after reservations, commitments, damage, and holds are removed.
- Days of supply: Estimated time inventory will last at the current rate of sales or usage.
- Stockout rate: How often items or locations become unavailable during a selected period.
- Fill rate: The share of customer or production demand supplied from available inventory.
Efficiency and Risk
- Inventory turnover: How often stock is sold or consumed during a defined period.
- Supplier lead time: Time between placing an order and receiving it.
- Excess and slow-moving inventory: Stock that consumes cash and space without reliable demand.
Build a Clear Layout
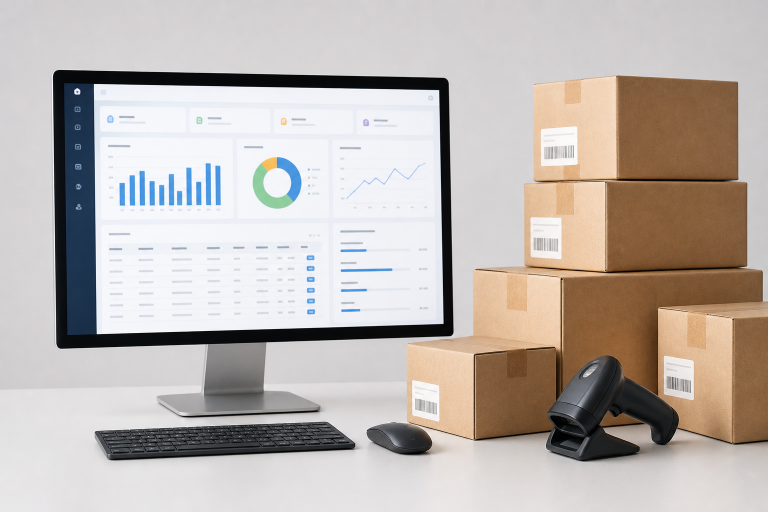
Put urgent issues at the top, followed by trend context and detailed records. Use a small number of summary cards to show overall availability, inventory value, open replenishment risks, and stock accuracy. Use charts for trends and comparisons, while tables or detailed lists should support SKU-level review.
Group the screens by work, such as replenishment, receiving, fulfillment, and inventory accuracy. Keep filters visible, clearly show the current location or date range, replace internal codes with plain language, and display the last refresh time beside live operational metrics.
Use Alerts for Exceptions
Alerts should identify unusual or risky conditions, not repeat routine activity. Each alert needs a threshold, severity level, owner, first-seen time, likely business effect, and recommended next step. Users should also be able to mark an alert as reviewed, resolved, or not applicable.
- Low stock against expected demand.
- Unexpected demand spikes or abnormal order volume.
- Late purchase orders and missed supplier commitments.
- Negative inventory or sudden stock adjustments.
- Count mismatches, overdue cycle counts, and expiring items.
Make Data Quality Visible
A stock number without context can create false confidence. Show whether the number is confirmed or estimated, when it was updated, which source supplied it, and whether the underlying record is incomplete. Flag missing product data, unusual changes in quantity, and locations with overdue counts.
Audit detail matters as well. Users should be able to see who changed a stock value, when the adjustment occurred, and whether it was due to a barcode scan, receipt, return, transfer, order allocation, or manual correction. Practical dashboard design best practices also emphasize designing views that people can revisit during routine work.
Create Role-Based Views
One dashboard rarely serves every role well. Warehouse teams need pick queues, receiving tasks, bin shortages, and count work. Purchasing teams need reorder points, supplier lead times, open orders, and cost changes. Operations managers need service levels, aging stock, and location performance. Finance teams need inventory value, carrying cost, write-down risk, and cash tied up in excess inventory.
Executives typically need the shortest view: availability, working-capital exposure, major demand shifts, and top unresolved exceptions. Role-based views reduce clutter while preserving shared metric definitions across the organization.
Implement and Improve the Dashboard
- Define the users and the decisions each user makes.
- Map sales, purchasing, warehouse, returns, supplier, and product data sources.
- Agree on definitions for available stock, stockouts, turnover, and lead time.
- Build a small first version centered on daily actions and high-risk alerts.
- Test real scenarios, including late shipments, demand spikes, and incorrect counts.
- Review the design with the frontline warehouse and purchasing users.
- Set a weekly routine to review alert volume, data accuracy, and unresolved issues.
Avoid Common Mistakes
- Showing every available metric on the first screen.
- Using color as the only signal of urgency or risk.
- Mixing daily, weekly, and monthly numbers without clear labels.
- Hiding important SKU details behind too many clicks.
- Creating alerts without assigning ownership.
- Using averages that conceal shortages at individual locations.
- Changing metric definitions without notifying users.
- Ignoring small-screen needs in warehouse environments.
Measure Success
Dashboard page views do not prove operational value. Measure whether teams find stock issues faster, act on alerts sooner, improve location-level accuracy, reduce stockouts, lower excess inventory value, and decrease repeated manual adjustments. Also track overdue purchase orders, ignored alerts, and feedback from the people who rely on the dashboard every day.
Conclusion
A strong inventory dashboard is not defined by its number of charts. It succeeds when people can spot a risk, understand its cause, and take the next useful action with confidence. Start with decisions, keep metrics focused, clearly show data quality, and improve the design through regular feedback. When the dashboard reflects how teams actually work, stock data becomes part of the daily operating routine.